The video analytics metrics that matter are the ones that answer your next business question: play rate tells you whether the placement earns attention, retention tells you where the video loses it, clicks and conversions show whether viewers act, and playback-quality data explains when a technical problem is getting blamed on the creative.
📋 TL;DR • Start with the video’s job: Choose one primary outcome, then add behavior and delivery metrics that explain it. • For an embedded business video: Track play rate, average percentage viewed, CTA or conversion rate, assisted conversions, and failed starts or buffering. • Views need context: A view count cannot tell you whether the right people watched, understood the offer, or became customers. • Use a small scorecard: One outcome metric, two supporting behavior metrics, and one playback-quality diagnostic is enough for a weekly review.
Video analytics is not a contest to collect every event your player or social platform exposes. It is a measurement system for deciding what to change: the opening, length, thumbnail, page placement, call to action, traffic source, or video delivery.
The reports worth opening are the ones that connect a player event to a page decision: change the creative, change the placement, or fix delivery. Every other chart in the dashboard is trivia you will never act on.
ℹ️ What is video analytics? Video analytics is the collection and interpretation of viewing, engagement, conversion, and playback data to evaluate how a video performs against a defined goal. In this guide, it means online video measurement for websites and marketing platforms—not computer-vision surveillance analytics.
The five questions your dashboard should answer
Before choosing a metric, write down the decision it should support. Use the five layers to connect reporting to action.
| Layer | Question | Useful metrics | Decision |
|---|---|---|---|
| Reach | Did the intended audience have a chance to see it? | Impressions, unique viewers, play rate | Change distribution or placement |
| Attention | Did viewers stay for the useful part? | Watch time, average percentage viewed, retention | Edit the opening, pacing, or structure |
| Action | Did they take the next step? | CTA clicks, form starts, conversion rate | Move or rewrite the CTA |
| Business value | Did the video contribute to revenue? | Qualified leads, pipeline, assisted conversions, revenue | Keep, scale, or replace the video |
| Experience | Could the viewer start and watch it reliably? | Startup time, rebuffer rate, playback errors | Fix hosting, encoding, or page weight |
These layers are connected, but they are not interchangeable. High reach with a weak play rate points to a placement or thumbnail problem. Flip it—strong play rate, early retention collapse—and the opening is writing checks the rest of the video cannot cash. When engagement looks healthy but conversions stay flat, the problem is sitting in the offer or the measurement path, not in the edit.
Reach and relevance: are the right people starting?
1. Impressions and unique viewers
Impressions count opportunities to see a video, while unique viewers estimate the number of distinct people exposed to it. They answer a reach question, not a quality question. A campaign can accumulate many impressions through repeat exposure without creating many starts or meaningful attention.
Use impressions to compare channels, campaigns, audiences, and placements. Use unique viewers when frequency matters, such as retargeting where the same prospect may see a video several times. Document whether an impression means a loaded player, an eligible feed item, or a served ad.
2. Play rate
Play rate is the percentage of relevant page loads or impressions that produce a video play:
Play rate = video plays ÷ eligible page loads or impressions × 100
For an embedded website video, this beats a raw play count because it counts the opportunity to watch, not just the watching. A low play rate points at one of five things: an unhelpful poster frame, weak surrounding copy, a player below the fold, poor mobile placement, or a page where visitors simply do not need a video. A high play rate paired with low retention means the thumbnail or headline promised something the opening did not deliver.
 Impressions measure how many people could have watched; play rate measures how many actually chose to. The gap between them is usually a placement, thumbnail, or page-context problem rather than a content problem.
3. Traffic source and audience segment
Traffic source and audience segment show where viewers came from and what context they brought with them. Break results out by search, paid, email, social, device, geography, and page type; search visitors often watch longer while paid traffic produces more qualified leads.
Preserve source and medium all the way through the form submission. A segment that disappears at the handoff cannot be credited later, and that is where most video attribution quietly breaks. HubSpot’s survey of more than 1,000 social media marketers found that respondents rated platforms differently for traffic, engagement, and audience growth (HubSpot, 2025).
Attention: what happens after the click?
4. Watch time
Watch time is the total amount of time viewers spend watching. It is a useful scale metric: two videos with the same play count may create very different amounts of attention. It also matters for comparing content libraries, but total watch time favors longer videos and larger distribution, so pair it with a rate or per-view measure.
For a product demo, ask whether viewers reach the proof or feature that supports the page’s goal. For a course lesson, ask whether learners reach the exercise or assessment. If watch time is low, check whether the first useful moment arrives too late; if it is high but action is low, inspect the page’s next step.
5. Average view duration
Average view duration is the average time watched per play. It gives you a more comparable view of attention than total watch time, but it still favors longer videos when used alone. Report it beside video length and average percentage viewed, not as an isolated number of seconds.
Compare videos with similar jobs and lengths. A 90-second demo with a 48-second average may be healthy if the CTA appears at 40 seconds; the same number is concerning for a 10-minute lesson whose key instruction appears at minute six. Use the result to place the explanation, not to enforce a universal duration target.
6. Average percentage viewed
Divide average view duration by the video’s total duration and you get average percentage viewed. It normalizes attention across different lengths, which makes it the only fair way to compare a 45-second explainer with a three-minute case study. It still cannot tell you whether the watched portion contained the important message, so read the retention curve next.
7. Audience retention and drop-off points
Audience retention shows how the watching audience changes across the timeline. The first major drop tells you where the promise, pacing, or delivery stopped working. A gradual decline suggests normal loss of interest; a sharp fall after a specific sentence, transition, or technical interruption gives you a concrete editing or implementation hypothesis.
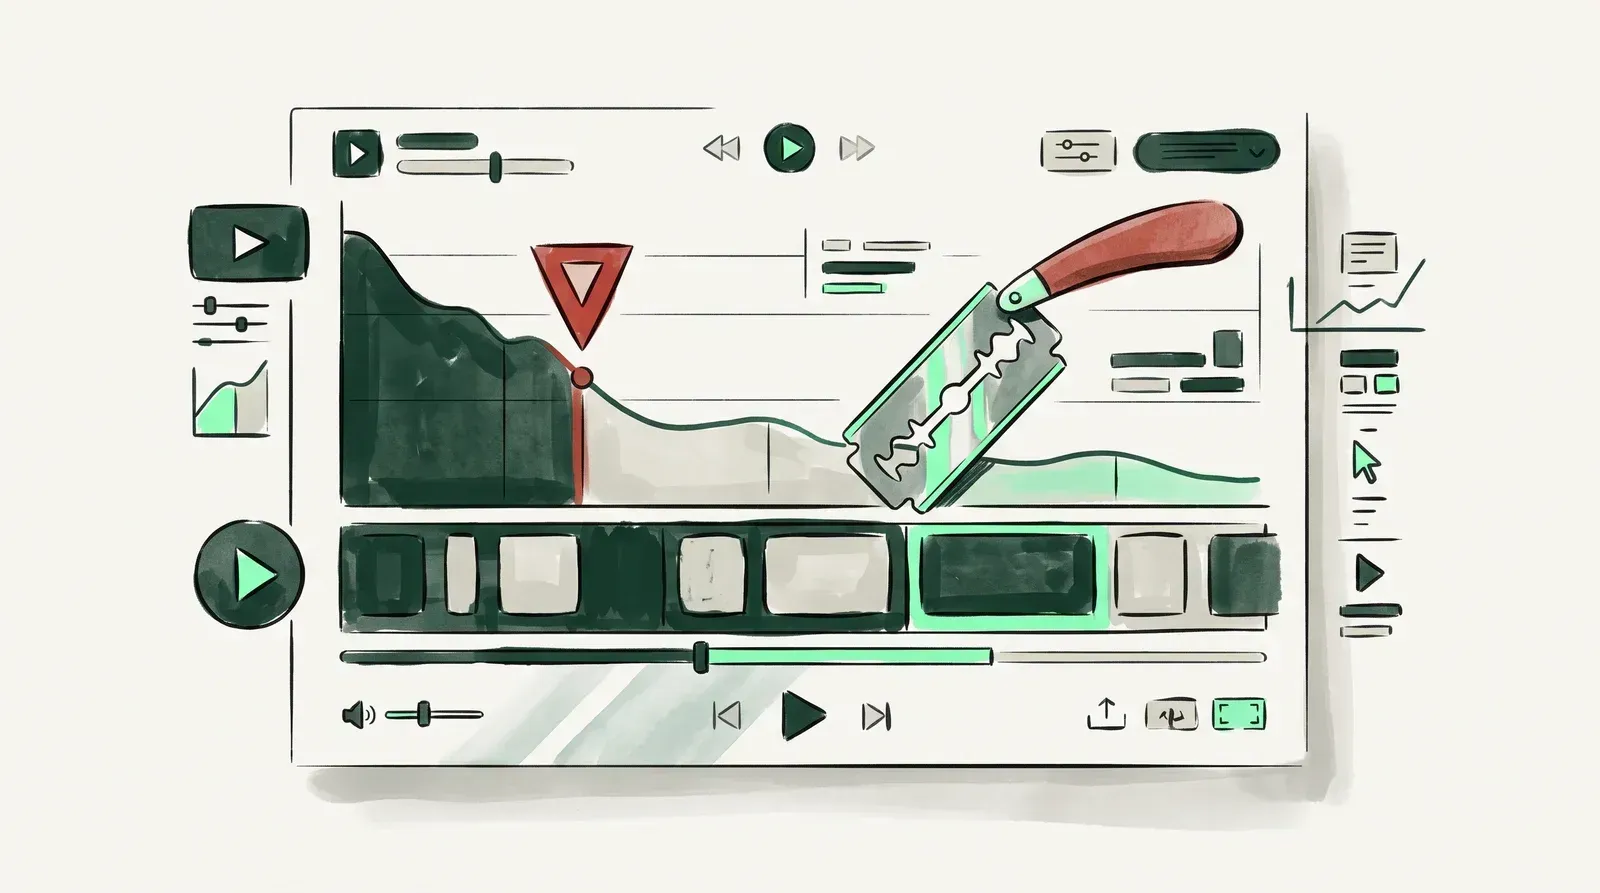 The steepest part of the retention curve is the most actionable edit in the whole report: it tells you exactly which seconds to tighten, trim, or move later.
Read the curve in three passes:
- Opening: A drop in the first moments means the poster frame, headline, or first sentence set the wrong expectation. Test a clearer promise or show the outcome sooner.
- Middle: A cliff at a transition marks repetition, jargon, or a missing visual. Cut the repeated explanation or add an example at that point.
- End: A fall before the CTA means the call to action may arrive too late. Move it earlier or make the ending shorter.
8. Rewatch and repeat plays
Rewatch rate identifies viewers who return to a section or play the video more than once. Replays can signal clarity problems, high interest, a technical retry, or a useful reference—analytics alone cannot tell you which. Segment repeat plays by video type and inspect whether they cluster around a demonstration, instruction, or playback failure.
For training, repeated sections may identify material that needs a transcript or clearer explanation. For a product video, rewatching a feature demonstration can inform lead scoring. Exclude rapid reloads and internal testing.
Action: did viewing change behavior?
9. CTA click-through rate
CTA click-through rate measures the share of viewers who click the next-step link, button, form prompt, or in-player call to action:
CTA CTR = CTA clicks ÷ eligible video plays or viewers × 100
Choose the denominator deliberately. Use viewers when you want to know how many people acted; use plays when repeat sessions are meaningful. Track the CTA’s location and timestamp so you can tell whether the click followed a key proof point or occurred before the viewer had enough context.
A low CTR is not automatic failure. A discovery video is often built for awareness, and its real call to action frequently sits outside the player. Report clicks with the next event—form start, signup, booking, or purchase.
10. Conversion rate and page-level conversion lift
Video conversion rate is the percentage of eligible viewers or sessions that complete the defined conversion. For a website embed, connect player events to page analytics and measure conversions among viewers versus comparable non-viewers. A controlled test—video present versus video absent, or one placement versus another—gives stronger evidence than a simple “people who watched also bought” report. For lead-focused videos, connect watch behavior to the qualified lead rather than stopping at a play.
Keep the unit of analysis consistent: use page sessions for a landing page and leads or accounts for a longer funnel. Define a fixed attribution window, and measure form or checkout starts when final conversion volume is small.
Wistia’s 2026 State of Video combined a survey of nearly 1,000 marketers with analysis of more than 13 million videos totaling over 79 million hours of video content (Wistia, 2026). That scale supports treating conversion assists and engagement as distinct signals, but the findings are Wistia-platform data and survey responses, not a universal benchmark for every host (Wistia, 2026).
11. Assisted conversions
An assisted conversion is a conversion where the video interaction occurred somewhere in the customer journey without receiving the final conversion credit. This matters for testimonials, explainers, and case studies that build confidence before a later branded-search or direct visit.
Assistance is not proof of causation. Compare viewers with a defined non-viewer group, record first and last touch separately, and show assisted conversions beside conversion rate and sample size.
 Video rarely closes the deal on its own. Assisted-conversion reporting credits the play that moved someone along the path, even when the signup happens days later from a different channel.
Business value: did video contribute to revenue?
12. Qualified leads, pipeline, revenue, and ROI
Qualified leads, pipeline, revenue, and ROI are the lagging indicators that connect video to the business. Define the conversion event before you publish: a demo request, sales-qualified lead, activated account, completed purchase, or retained learner. Then pass the video ID and meaningful engagement events into the CRM or analytics system.
Do not force every video to prove revenue directly. A brand film may use reach and branded search; a product demo, qualified pipeline; an onboarding lesson, activation or support-ticket reduction. Supporting metrics explain why the primary result moved.
ROI is only as credible as the cost model behind it. Include production, editing, media spend, hosting, promotion, and the value of internal time. Wyzowl’s 2026 survey reports that 82% of marketers say video gives them good ROI, while 67% of video marketers quantify ROI through views and 32% through bottom-line sales. Those are self-reported survey responses, not causal proof, but the gap illustrates why teams should move beyond the easiest signal to collect (Wyzowl, 2026).
Playback experience: can viewers watch without friction?
Startup time and failed starts
Startup time measures the delay between a play request and the first rendered frame. Failed starts count sessions where playback was requested but never began. These are diagnostic metrics, but they belong in a marketing dashboard because a viewer cannot engage with a video that never starts.
Break them out by browser, device, geography, connection type, page template, and video rendition. A high failed-start rate on mobile points at the format; a spike confined to one page template points at a script conflict. Check these numbers before you rewrite a video whose retention looks weak—an edit cannot fix a player that never loaded.
Rebuffer rate and playback errors
Rebuffer rate is the share of playback time spent waiting for data, while playback errors record interruptions such as a failed manifest, unsupported format, or network error. A small average can hide a severe problem for a specific segment, so report the distribution and affected sessions when the platform supports it.
We’ve seen the same retention chart lead to two different fixes: one video needed a tighter opening, while another needed better delivery on the page. If a retention drop lines up with buffering or errors, fix the playback path before you draw a creative conclusion.
Rewriting a script to solve a bandwidth problem wastes a week and changes nothing. Our guides on video speed and conversions and video quality of experience cover that relationship in more detail.
 A failed start never shows up as a bad retention curve, because the viewer never got a first frame. Track startup time and error rate separately or delivery problems will be misread as weak creative.
🚀 Make the measurement path part of the hosting decision If your videos live on your own website, choose a host that lets you connect engagement with the page and inspect delivery quality. SmartVideo combines CDN-accelerated delivery with an ad-free, branded player, so your analytics can focus on whether the video helped the page rather than on viewer leakage or unrelated recommendations. Compare plans for your video measurement needs →
Which metrics matter for each video type?
Use the video’s job to choose a primary metric. The examples below are starting points, not universal benchmarks.
| Video type | Primary metric | Supporting metrics | First decision to test |
|---|---|---|---|
| Brand or awareness video | Qualified reach | Play rate, average percentage viewed, branded search | Change audience or opening promise |
| Product demo | Qualified conversion rate | Retention to proof point, CTA CTR, pipeline | Move proof or CTA earlier |
| Customer story | Assisted pipeline | Watch time, account engagement, sales influence | Target accounts and distribution |
| Tutorial or training | Completion of the learning task | Retention at instruction, rewatch, assessment result | Add chapters or revise the unclear section |
| Landing-page video | Page conversion lift | Play rate, CTA CTR, startup time | Test placement and page copy |
Before choosing KPIs, define the job of each video in your broader video marketing strategy. A metric becomes useful when the team knows what it will do if the number rises, falls, or stays flat.
A simple weekly video analytics dashboard
A weekly report should be small enough to review and specific enough to produce a decision. Create one row per video or page with:
- Primary outcome: qualified conversion rate, assisted pipeline, learning completion, or qualified reach.
- Behavior metric one: play rate or unique viewers, depending on whether the issue is exposure or audience size.
- Behavior metric two: average percentage viewed, retention to the key moment, or CTA CTR.
- Delivery diagnostic: startup time, failed starts, rebuffer rate, or playback errors.
- Segment: source, device, page, campaign, or audience—not just the blended total.
- Decision: one sentence describing the next change and the date it will be reviewed.
Set a baseline before you change the video. Record the date range, video version, placement, traffic mix, denominator, and attribution window. With a small sample, take the directional read; when the stakes are high, run a controlled comparison and write down the decision rule before you look at the result.
Wistia reported that videos hosted on its platform generated 2.5 billion plays in 2025, up 6% year over year. The point is simple: play count alone says little about business impact (Wistia, 2026).
Common video analytics mistakes
Using views as the success metric
Views measure exposure under a platform’s definition. They do not tell you whether the viewer was relevant, stayed for the central point, clicked the offer, or experienced a failed start. Use views to size reach, then add an attention or outcome metric.
Comparing incompatible view definitions
A social feed, YouTube, and an embedded website player can count a “view” at different thresholds and under different autoplay rules. YouTube’s own analytics documentation separates metrics such as views, watch time, average view duration, and audience retention; use the platform definition instead of importing a benchmark from another system (YouTube Help, 2026).
Ignoring autoplay and repeat plays
Muted autoplay can create a play without a deliberate click, while looped background video can create repeated plays without equivalent attention. Label autoplay, click-to-play, and looped placements separately. Exclude internal traffic, bots, preview requests, and reload retries where your analytics system allows it.
 Muted autoplay and looped background placements manufacture plays nobody chose to start. Label them separately before you compare play counts across pages.
Optimizing completion instead of the job
Completion rate is valuable for a lesson whose final step matters. It is less useful for a short product video if viewers who watch 40 seconds already see the proof and CTA. Measure retention to the meaningful moment and the action that follows it.
Calling correlation attribution
People who watch a video may already be more motivated than people who do not. Use UTMs, player events, page analytics, CRM fields, and a control or pre-video baseline to improve your estimate. Nielsen’s 2025 Annual Marketing Report found that only 32% of global marketers measure media spending holistically across digital and traditional channels, which puts a practical limit on how precisely many teams can assign credit (Nielsen, 2025).
Blaming creative for a delivery problem
A drop in retention can come from a confusing sentence, but it can also follow a failed start, long startup delay, or buffering event. Put playback diagnostics beside engagement charts. A video host that exposes delivery-quality signals helps you separate an edit request from an infrastructure fix.
FAQ
What are the most important video analytics metrics?
For an embedded business video, start with play rate, average percentage viewed, retention to the key moment, conversion rate, and failed starts or buffering. Add qualified pipeline or revenue when the video is connected to a sales process, and define the denominator for every metric before comparing videos.
How do you measure video performance?
Define the video’s job, set a baseline, connect player events to page analytics, segment by source and device, and review one outcome metric with supporting behavior and delivery metrics. A product demo might use qualified form submissions as its primary outcome, while a training video might use assessment completion.
What is a good video completion rate?
There is no universal good completion rate because a 30-second ad, a 90-second demo, and a 40-minute lesson have different jobs. Judge completion against the moment that matters: for example, whether viewers reach the qualification step or the lesson assessment, and whether that behavior improves the intended outcome.
How do you calculate video engagement rate?
Choose the interaction you mean, then divide it by a declared denominator: CTA clicks divided by viewers, watched seconds divided by available seconds, or meaningful interactions divided by impressions. Avoid one generic engagement formula across platforms because autoplay, repeat plays, and view thresholds change the result.
Is video completion rate more important than watch time?
Neither metric is inherently more important; the video’s job decides. Completion is useful when the final section contains the required instruction, while watch time is useful when total attention or a long-form library matters. For a lead-generation video, qualified actions can outrank both.
How do you track conversions from a video?
Send a video ID, page URL, timestamped engagement event, campaign source, and viewer or session identifier into your analytics system, then connect the record to a form, signup, booking, or purchase event. Use a defined attribution window and, when possible, compare viewers with a similar non-viewer group.
What metrics should I track for an embedded website video?
Track eligible page loads, plays, play rate, average percentage viewed, CTA clicks, page conversion rate, assisted conversions, startup time, failed starts, and rebuffer rate. For a small weekly dashboard, choose one primary outcome, two behavior metrics, and one delivery diagnostic.
What is video play rate?
Video play rate is video plays divided by eligible page loads or impressions, multiplied by 100. On a website, it shows whether the placement and poster frame earn a start; define whether autoplay starts count before comparing click-to-play and autoplay placements.
Why are video views considered a vanity metric?
Views are called a vanity metric when they are reported without audience, attention, action, or business context. They become useful when paired with the eligible audience, play rate, retention to a meaningful point, and a downstream result such as a qualified lead.
How do you measure video marketing ROI?
Calculate ROI by comparing attributable or incrementally influenced gross profit with the full cost of production, distribution, hosting, and promotion. Keep assisted pipeline separate from closed revenue, use a fixed attribution window, and label survey-based ROI claims as self-reported rather than causal.
Conclusion: measure the next decision
Video analytics works when each number earns its place. Start with the business outcome, use play and retention data to understand viewer behavior, and keep startup time, buffering, and errors beside the engagement chart so technical friction does not get mistaken for weak content. If you host video on your website, page placement and conversion context matter as much as what happens inside the player.
For businesses that want owned-site video hosting without ads, related-video leakage, or bandwidth metering, SmartVideo provides CDN-accelerated delivery and a branded player with plans that scale by views and storage. See whether SmartVideo fits your video analytics workflow.